Research · Unpublished manuscript
Semiconductor Billings Beyond Forecasts: Comparing the Dot-Com and AI Booms
Georgii Demkin · Sole author · Reviewed by Professor Tolulope Fadina
Did worldwide semiconductor billings depart more strongly and persistently from forecasts during the AI boom than during the dot-com boom?
Method
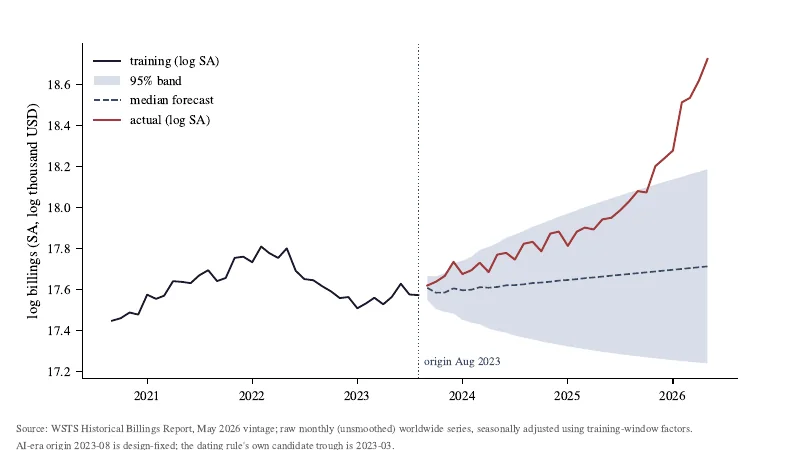
I compared raw monthly billings from the World Semiconductor Trade Statistics historical series through May 2026. Each episode uses a 120-month training window and a 33-month forecast horizon. I applied the same model-selection rule to each window; it selected ARIMA(4,1,3) for dot-com and ARIMA(3,1,0) for the AI era, both with drift.
Finding
Both episodes had eight months above their model-based 95% prediction intervals. The dot-com path returned inside its interval. The AI-era path ended with seven consecutive months above its interval, reaching 4.19 standard deviations above its forecast in May 2026.
Limits
This comparison does not establish that AI caused the increase. The AI-era episode was still ongoing at the end of the sample, billings are measured in nominal dollars, and the prediction intervals depend on model assumptions. The result remains provisional.